![]() Figure 3 of
Yin, Mol Vis 2006;
12:858-866.
Figure 3 of
Yin, Mol Vis 2006;
12:858-866.
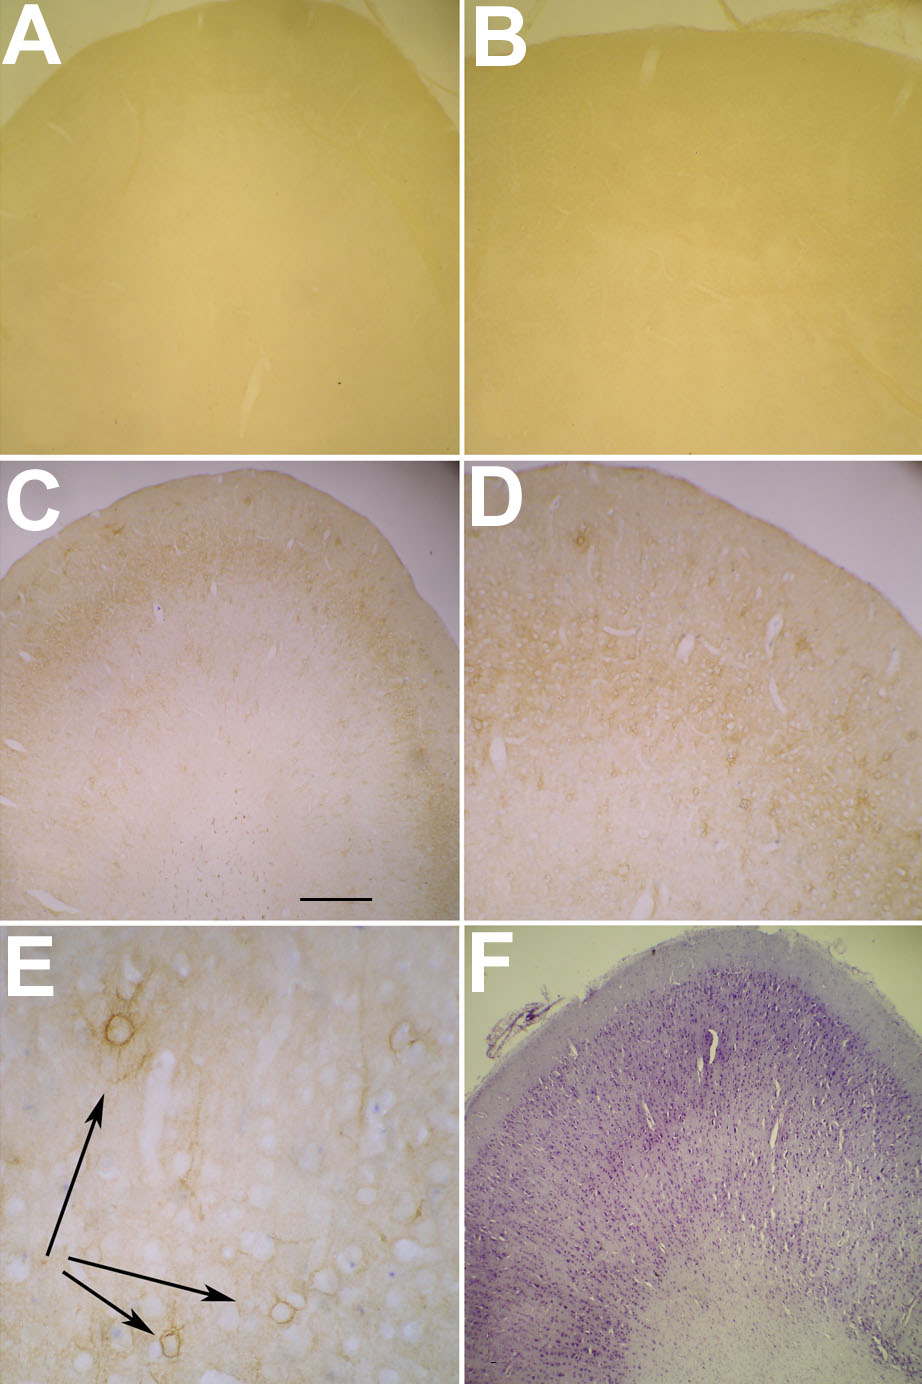
Figure 3. Cortex controls-Y-block
This figure contains negative controls, positive immunostaining and counterstaining for sections obtained from the visual cortex of a Y-block cat as well as comparison of counterstaining with normal cat. A: Negative control slide from the left side cortex of Y-block cat using an IgE control as the primary antibody and no counterstaining. Magnification 40x. B: Same section as Panel A, but photographed at higher magnification (100x). C: Positive cat-301 antibody labeling from the left cortex of Y-block cat with no counterstaining. Magnification 40x. D: Same section as Panel C, but photographed at higher magnification (100x). E: Same section as Panel C, but photographed at yet higher magnification (400x), and clearly showing the perioneuronal net labeling. F: Negative control, counterstained with cresyl violet from the left cortex of Y-block cat. Magnification 40x. The scale bar shown in Panel C applies to all six panels and represents 1 mm for Panels A,C,E; 400 μm for Panels B,D; and 100 μm for Panel F.