![]() Figure 4 of
Park, Mol Vis 2006;
12:832-840.
Figure 4 of
Park, Mol Vis 2006;
12:832-840.
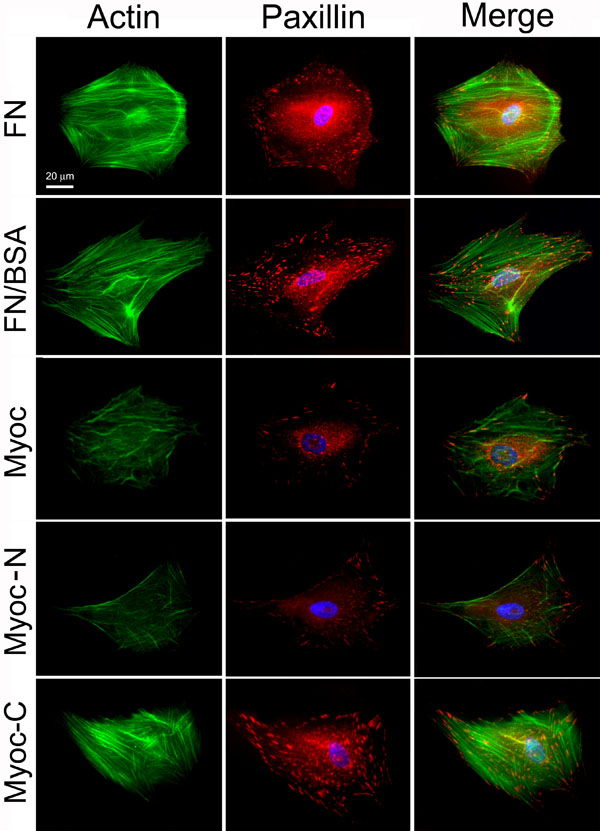
Figure 4.
Actin and paxillin staining patterns in human TM cells. The cells were plated for 4 h on fibronectin (FN; 5 μg/ml), or fibronectin (FN; 5 μg/ml) mixed with BSA (5 μg/ml), bacterial full length myocilin (Myoc; 5 μg/ml), myocilin 1-270 (Myoc-N; 2.5 μ/ml), or myocilin 271-504 (Myoc-C; 5 μg/ml). Green fluorescence, actin; red fluorescence, paxillin. Nuclei were stained with DAPI in blue. The merged images for actin (green) and paxillin (red) are also shown. The original magnification was 40x. The scale bar represents 20 μm.