![]() Figure 3 of
Park, Mol Vis 2006;
12:832-840.
Figure 3 of
Park, Mol Vis 2006;
12:832-840.
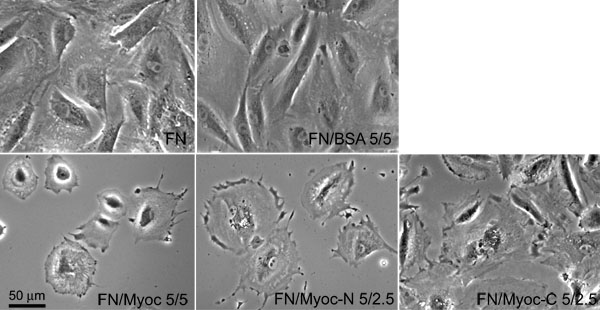
Figure 3.
Phase contrast micrographs of human TM cells. The cells were plated for 1 h on wells coated with fibronectin (FN; 5 μg/ml), fibronectin/BSA (FN/BSA; 5/5 mg/ml), fibronectin/bacterial full length myocilin (FN/Myoc; 5/5 μg/ml), fibronectin/myocilin 1-270 (FN/Myoc-N; 5/2.5 μg/ml), or fibronectin/myocilin 271-504 (FN/Myoc-C; 5/2.5 μg/ml). Experiments were repeated five times, yielding similar results. The original magnification was 10x. The scale bar represents 50 μm.