![]() Figure 1 of
Park, Mol Vis 2006;
12:832-840.
Figure 1 of
Park, Mol Vis 2006;
12:832-840.
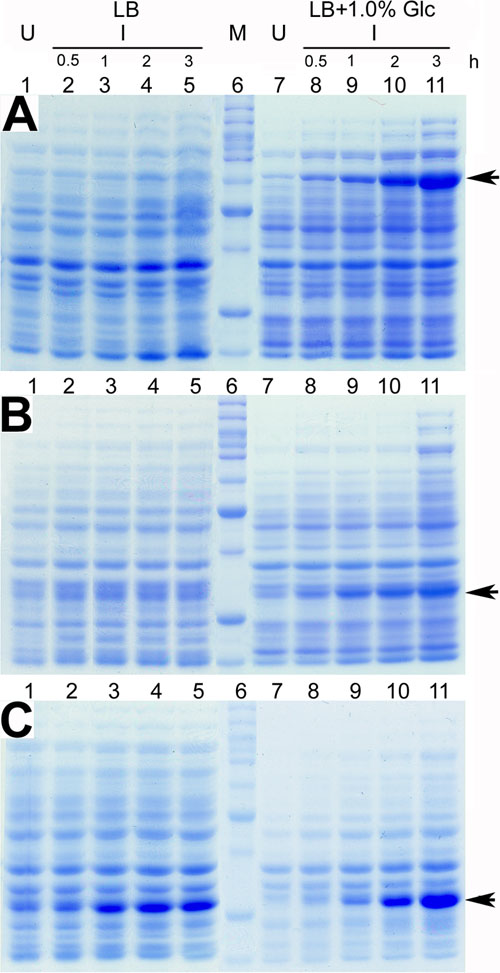
Figure 1.
Expression of full length myocilin (A), myocilin 1-270 (B), and myocilin 271-504 (C) proteins in Rosetta2(DE3)pLysS. The bacteria were grown in LB medium without (lanes 1-5) or with (lanes 7-11) supplementation of 1.0% glucose (LB + 1% Glc). Protein expression was then induced in 0.2 mM IPTG. Aliquots for SDS-PAGE analyses were from uninduced control (U), and samples (I) induced for 0.5, 1, 2, or 3 h. Proteins were visualized by Coomassie blue staining. Arrows denote the induced proteins. Lane 6 shows molecular weight markers (M). The size of marker proteins from the top is 120, 100, 90, 80, 70, 60, 50, 40, 30, and 25 kDa, respectively.