![]() Figure 3 of
Zhang, Mol Vis 2006;
12:821-831.
Figure 3 of
Zhang, Mol Vis 2006;
12:821-831.
Figure 3.
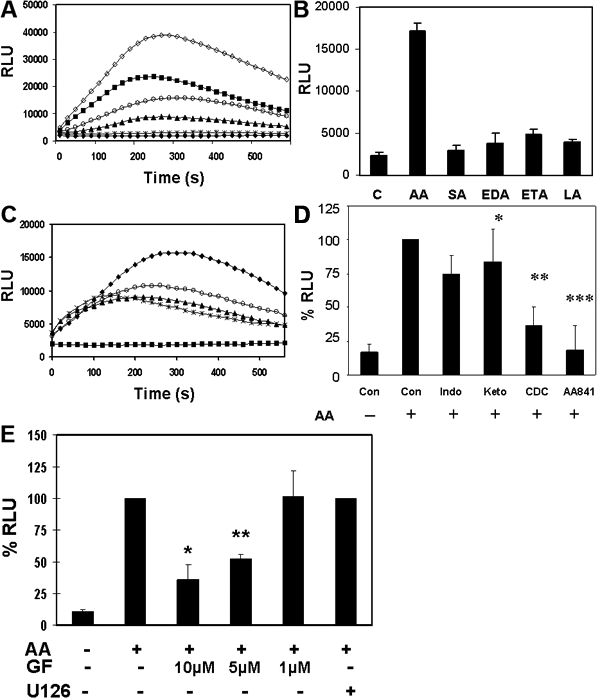
Arachidonic acid stimulated superoxide anion production in the intact HLE B3 cells. Confluent cells were deprived from serum for 30 min, washed twice with PBS, trypsinized and cell pellets collected after centrifugation. The pellet was resuspended in HBS buffer and AA added to initiate superoxide anion generation in the presence of lucigenin. Superoxide anions were quantified using LUCL analysis on the intact cell suspension. The luminescence was measured by BMG luminometer and expressed as Relative Light Unit (RLU). Ethanol (3%), which was used as a solute for AA, was the control blank. A: Dose-dependent superoxide anion generation: AA at dosage of 30-150 μM was used to induce luminescence production (RLU) in cells (0.2 million) during the 10 min stimulation. Four separate experiments were carried out. A typical pattern is shown. Solid circle: Ethanol; Star: 30 μM; solid triangle: 60 μM; open circle: 90 μM; solid square: 120 μM; open diamond: 150 μM. B: Effect of AA derivatives and other long-chain fatty acids on ROS generation in HLE B3 cells. AA (90 μM) stimulation in cells (0.2 million) was compared with 90 μM of stearic acid (18:0; SA), or linoleic acid (18:2; LA), or derivatives of AA eicosa-11Z,14Z-dienoic acid (20:2; EDA) and eicosa-11Z, 14Z, 17Z-trienoic acid (20:3; ETA). Ethanol (3%) was the control. Superoxide anion was captured as luminescence at 240 s and expressed in relative light unit. The data is expressed as mean±SD with two separate experiments. C: Inhibition of AA-induced ROS generation in HLE B3 cells by SOD, DPI and mannitol. Cells (0.2 million) were preloaded with 0.4 mg/ml SOD or 20 mM mannitol, or 10 μM DPI before treatment with 90 μM AA in the presence of lucigenin. The luminescence was monitored for 10 min. Solid square: 3% ethanol (baseline); solid diamond: AA alone; solid triangle: SOD + AA; open circle: mannitol + AA; Star: DPI + AA. Three separate experiments were carried out. A typical pattern is shown. D: Effect of inhibition of AA metabolic pathways on ROS generation cells (0.2 million) were stimulated by 90 μM of AA under the same conditions as above, except the cells were preloaded with each inhibitor for 30 min in HEPES-buffered saline followed by AA stimulation. Superoxide anion production was captured as luminescence in relative light unit at 240 s. The percent inhibition by 20 μM cytochrome p450 inhibitor (ketoconazole, or Keto), 20 μM cyclooxygenase inhibitor (indomethacin, or Indo), 20 μM pan lipoxygenase inhibitor (CDC) or 2 μM 5-lipoxygenase inhibitor (AA 861) was compared with AA alone (100%). The data is expressed as mean±SD with 3 separate experiments. The single asterisk indicates a p<0.04, the double asterisk indicates a p<0.0002, and the triple asterisk indicates a p<0.000001. E: Effect of Inhibitors to protein kinase C and ERK1/2 on AA stimulated superoxide anion generation. Intact cells (0.2 million) in suspension were stimulated by AA (90 μM) in the presence and absence of pan PKC inhibitor (GF 109203X, or GF) at 1, 5, or 10 μM concentrations, or MEK inhibitor (U0126) at 10 μM. The intact cells were preincubated with inhibitor for 30 min before use. The data is expressed as mean±SD of percentage of inhibition in comparison to AA stimulation (100%), based on three separate experiments. Ethanol (3%) was included as background. The single asterisk indicates a p<0.0007 and the double asterisk indicates a p<0.00002.
