![]() Figure 1 of
Zhang, Mol Vis 2006;
12:821-831.
Figure 1 of
Zhang, Mol Vis 2006;
12:821-831.
Figure 1.
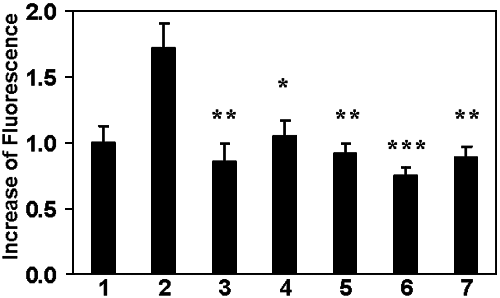
Inhibition of PDGF-induced ROS generation in HLE B3 cells. Cells (1.6 million) were used for the PDGF-induced ROS generation using confocal laser scanning microscope. For details see Materials and Methods. The cells were preloaded with the fluorescence generating dye of DCFH-DA (5 min) and inhibitor (30 min) before subjecting to PDGF stimulation. The value of the fluorescence intensity was the average of three separate measurements at the maximum ROS production time of 5 min. Bar 1: Control (no PDGF or inhibitor). Bar 2: PDGF (positive control, 5 ng/ml). Bar 3: PDGF + AACOCF3 (10 μM). Bar 4: PDGF + DPI (10 μM). Bar 5: PDGF + AA861 (2 μM). Bar 6: PEGF + GF 109203X (10 μM). Bar 7: PDGF + U0126 (10 μM). The single asterisk indicates a p<0.0001, the double asterisk indicates a p<0.00002, and the triple asterisk indicates a p<0.000004.
