![]() Figure 3 of
Liton, Mol Vis 2006;
12:774-790.
Figure 3 of
Liton, Mol Vis 2006;
12:774-790.
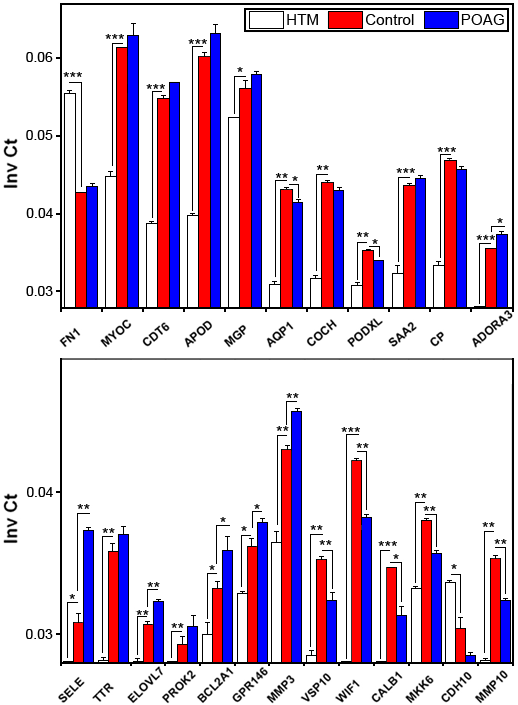
Figure 3.
Real-time confirmation of selected genes with differential expression among cultured human trabecular meshwork (HTM) cells, HTM tissue, and POAG trabecular meshwork (TM) tissue. Expression levels are represented as the inverse normalized mean Ct value±SD. Inv Ct values below 0.028 (Ct >35 cycles) were confirmed as primer-dimer products and are not included in the graphic. EIF4-α, which showed no variance in the expression levels between cultured HTM cells and TM tissue, was used for normalization. The single asterisk indicates a p<0.05, the double asterisk indicates a p<0.001, and the triple asterisk indicates a p<0.0001 (t-test, n=3).
