![]() Figure 3 of
Metlapally, Mol Vis 2006;
12:725-734.
Figure 3 of
Metlapally, Mol Vis 2006;
12:725-734.
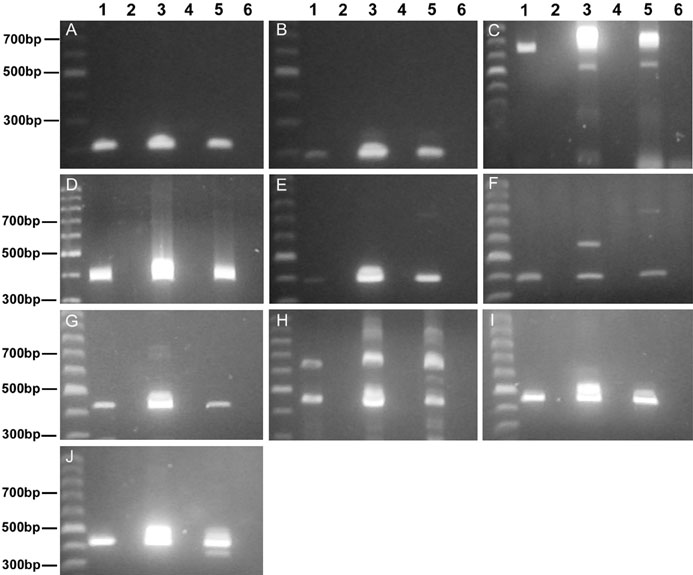
Figure 3.
Identification of α-integrin subunits expressed in the tree shrew sclera. Amplification products representing the α1- (A; 198 bp), α2- (B; 179 bp), α3- (C; 657 bp), α4- (D; 383 bp), α5- (E; 388 bp), α6- (F; 375 bp), α9- (G; 436 bp), α10- (H; 439 bp), α11- (I; 459 bp), and αv-integrin (J; 420 bp) subunits were detected in the tree shrew sclera and scleral fibroblasts using RT-PCR. Lanes 1, 3, and 5 represent scleral, scleral fibroblast, and skin cDNA, while lanes 2, 4, and 6 are the respective total RNA controls. Molecular markers (100 bp) are included for product size comparison.