![]() Figure 1 of
Metlapally, Mol Vis 2006;
12:725-734.
Figure 1 of
Metlapally, Mol Vis 2006;
12:725-734.
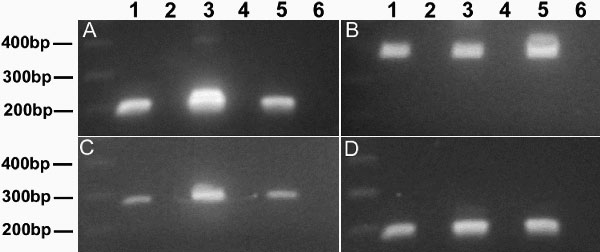
Figure 1.
Identification of β-integrin subunits expressed in the tree shrew sclera. Amplification products representing the β1- (A; 184 bp), β4- (B; 383 bp), β5- (C; 276 bp), and β8-integrin (D; 179 bp) subunits were detected in the tree shrew sclera and scleral fibroblasts using RT-PCR. Lanes 1, 3, and 5 represent scleral, scleral fibroblast, and skin cDNA, while lanes 2, 4, and 6 are the respective total RNA controls. Molecular markers (100 bp) are included for product size comparison.