![]() Figure 8 of
Pendergrass, Mol Vis 2006;
12:712-724.
Figure 8 of
Pendergrass, Mol Vis 2006;
12:712-724.
Figure 8.
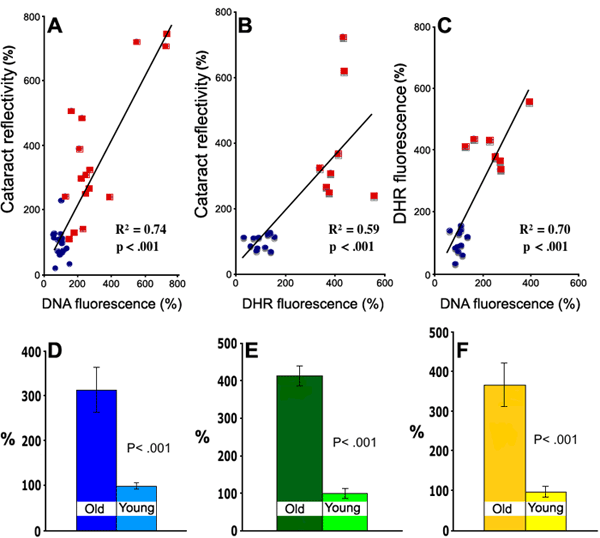
Quantitation of cataract reflection intensities, cortical DNA fluorescence, and cortical DHR fluorescence in young and old lenses. A: The correlation between cataract reflectivity (determined from the intensity of reflected light in digitalized low power light microscope photos) and cortical DNA fluorescence (mean Hoechst33342 fluorescence) averaged for both the posterior and anterior sides of young and old rat lenses. The relative fluorescence for each old rat lenses (25-31 months) is shown as red squares, and each young rat lens (4-5 months) is shown as blue circles. B: The correlation between cataract reflectivity and cortical DHR fluorescence of young and old lenses (note that fewer lenses were stained with DHR). C: The correlation between cortical DNA and cortical DHR in lenses stained with both stains. The p values (A-C) are from the 2 tailed Pearson correlation test. D-F: Bar graphs comparing the means of the cortical DNA, DHR, and cataract reflectivity for all old and young lenses in each age group; error bars represent standard errors of the mean.
