![]() Figure 4 of
Wang, Mol Vis 2006;
12:76-84.
Figure 4 of
Wang, Mol Vis 2006;
12:76-84.
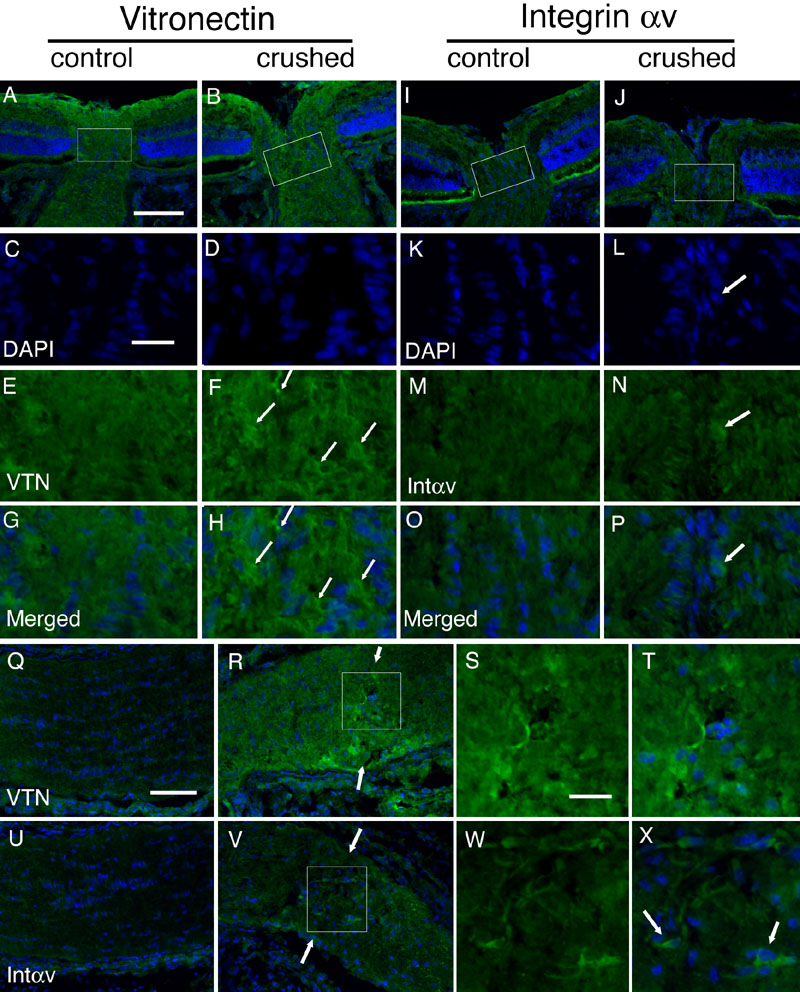
Figure 4. Increased expression of vitronectin and integrin αv over optic nerve head and optic nerve.
A-P: Sections of crushed (B,D,F,H,J,L,N,P) and contralateral control (A,C,E,G,I,K,M,O) optic nerve heads were stained with anti-vitronectin antiserum (VTN; A,B,E,F), anti-integrin αv antiserum (Intαv; I,J,M,N), and DAPI (C,D,K,L) at three days after optic nerve crush. High power fields (C-H,K-P) of the optic nerve head region (from the rectangles in A,B,I,J) are presented in each column with merged micrographs (G,H,O,P) below. Induction of vitronectin was found in the optic nerve head (F,H, arrows) and increased expression of integrin αv was found in the glia cells (L,N,P, arrows). Q-X: Sections of the crushed (R-T,V-X) and contralateral control (Q,U) optic nerves were stained with VTN (Q-T), Intαv (U-X), and DAPI (Q,R,T,U,V,X) at three days after optic nerve crush. Increased expression of vitronectin and integrin αv can be found in the crush line within the optic nerve. In these regions, vitronectin was found primarily in glial cells near the crush sites. Several glial cells (X, arrows) seem to express integrin αv on their cell surface as seen in the high-power field (S,T and W,X from R and V, respectively). The scale bars represent 100 μm in A,B,I,J; 25 μm in C-H,K-P,S,T,W,X; and 50 μm in Q,R,U,V.