![]() Figure 1 of
Wang, Mol Vis 2006;
12:76-84.
Figure 1 of
Wang, Mol Vis 2006;
12:76-84.
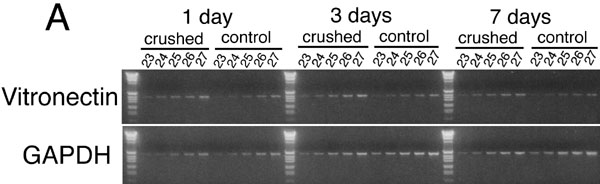
Figure 1. Increase of vitronectin mRNA expression in the retina after optic nerve crush
A: A semi-quantitative RT-PCR was adopted to examine the expression of vitronectin mRNA in the retina. RNA of both crushed and control retina at one day, three days, and seven days after crush was reverse-transcribed to cDNA and used as the template for PCR. Expression of GAPDH was used as an internal control. PCR products were removed after each cycle from cycles 23 to 27. B: Gel intensity (A) was analyzed using the ImageQuant software. The relative amount of vitronectin mRNA was expressed as ratios to that of GAPDH. Closed columns represent gel intensities of crushed groups and open columns represent those of control groups. Statistical analysis was performed with a paired t-test. Bars in graph represent means; the error bars represent the standard deviation. Both one day and three day groups revealed a statistically significant difference between the crushed and control retina (asterisk; p<0.05). Although the seven-day group also showed a similar trend, it was not statistically significant.