![]() Figure 2 of
Bando, Mol Vis 2006;
12:692-697.
Figure 2 of
Bando, Mol Vis 2006;
12:692-697.
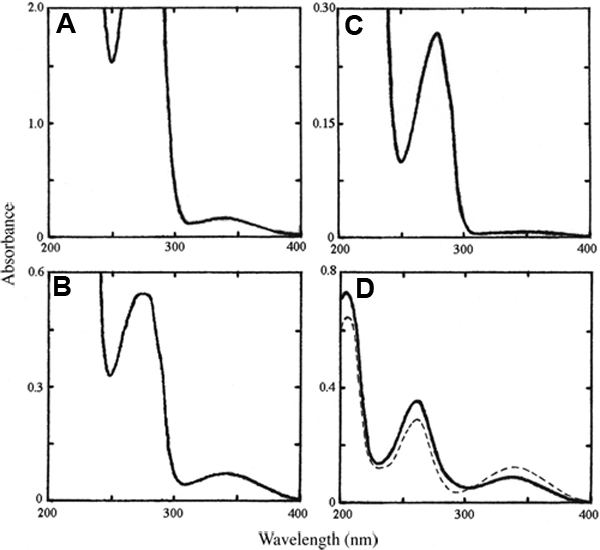
Figure 2. Absorption spectra of λ-crystallin samples prepared and treated
A: Absorption spectrum of λ/βL1-crystallin fraction (2.5 mg protein/ml) in 0.1 M KCl, 10 mM K-phosphate, pH 7.2. B: Absorption spectrum of partially purified λ-crystallin (0.47 mg protein/ml) in 10 mM K-phosphate, pH 7.2. C: Partially purified λ-crystallin (0.47 mg protein/ml) was treated with charcoal (0.6%), and absorption spectrum of the charcoal-treated protein solution (0.28 mg protein/ml) was measured. D: The cofactor bound to partially purified λ-crystallin (0.81 mg protein/ml) was extracted by 0.1% SDS in 10 mM K-phosphate (pH 7.2), and absorption spectrum of 0.1% SDS extracts was measured (solid line). The dotted line shows the absorption spectrum of an authentic compound of NADH (20 μM) in the same detergent solution.
