![]() Figure 2 of
Allison, Mol Vis 2006;
12:655-672.
Figure 2 of
Allison, Mol Vis 2006;
12:655-672.
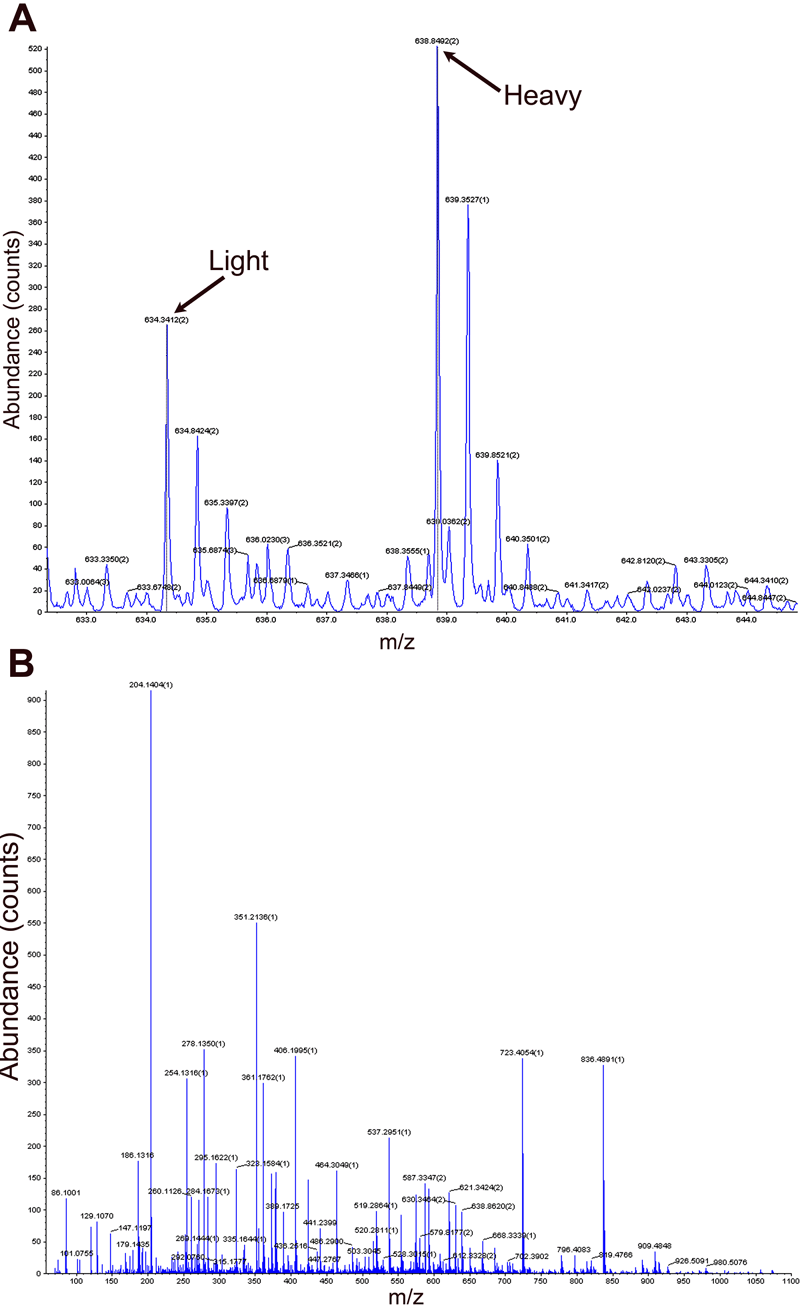
Figure 2. Mass spectra for the long-wavelength sensitive cone opsin, which increased in abundance during thyroid hormone treatment
A: Time-of-flight MS spectrum of isotope-coded affinity tag (ICAT) labeled peptides including light (D0) and heavy (D9) versions of the ICAT molecule. The difference in abundance between these peaks indicated that long-wavelength sensitive (LWS) opsin was 1.9 fold more abundant in the peptide pool from thyroid hormone-treated retinas, which was labeled with the heavy isotope of the ICAT molecule. B: MS/MS spectrum used to predict the sequence TCIMQLFGK. ProICAT software identified the protein as LWS opsin and these nine amino acids are an exact match to the peptide predicted from rainbow trout cDNA (AAM17921). The spectrum was validated by manual analysis. C: Ions observed in the spectra of B are highlighted in red.

C:
Residue Mass a b b-NH3 y ------- --------- --------- --------- --------- --------- T, Thr 101.0477 74.06 102.055 85.0284 1276.962 C, Cys 3339.1664 413.2264 441.2213 424.1948 1175.644 I, Ile 113.0841 526.3105 554.3054 537.2788 836.4777 M, Met 131.0405 657.351 685.3459 668.3193 723.3936 Q, Gln 128.0586 785.4095 813.4045 796.3779 592.3531 L, Leu 113.0841 898.4936 926.4885 909.462 464.2945 F, Phe 147.0687 1045.562 1073.557 1056.53 351.2105 G, Gly 57.0215 1102.584 1130.578 1113.552 204.1421 K, Lys 128.095 1230.678 1258.673 1241.647 147.1206 |