![]() Figure 4 of
Prow, Mol Vis 2006;
12:616-625.
Figure 4 of
Prow, Mol Vis 2006;
12:616-625.
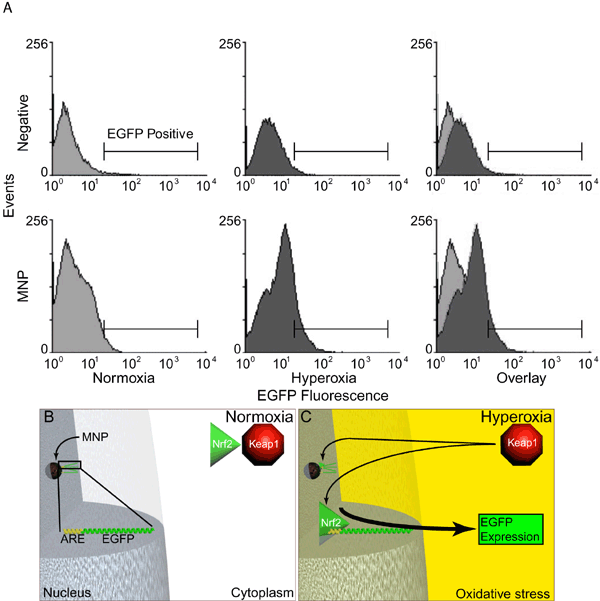
Figure 4. Activity of MNP tethered biosensor in hyperoxia and overview of this process
These flow cytometric data confirm that the cell induces the ARE on the MNP in response to hyperoxic insult, thereby resulting in the increased expression of the ARE driven EGFP reporter. This experiment illustrates the use of a functional biosensor tethered to a MNP that can detect and report a pathological state. A: Flow cytometric analysis of biosensor activity. These histograms are from cells exposed to normoxic or hyperoxic conditions, either with or without the biosensor. The right column contains composite images derived from both the normoxic and hyperoxic histograms. The transfection groups are a negative control (Negative, no DNA) and MNP-ARE-EGFP are shown in two rows. The y-axis represents events and the X-axis is GFP fluorescence. The bar indicates the GFP positive region used to calculate the percentage of GFP positive cells. B,C: An overview of the biosensor tethered nanoparticle in normoxic (B) and hyperoxic (C) conditions. Under normal conditions, the ARE repressor protein Keap1 (red octagon) prevents the ARE activator Nrf2 (green triangle) from leaving the cytoplasm (B). The nanoparticle tethered biosensor (MNP) is localized in the nucleus and consists of the ARE followed by a EGFP reporter gene (ARE EGFP). When exposed to hyperoxia (C), the cell experiences oxidative stress. This oxidative insult (yellow) initiates ARE activation by Nrf2 localization in the nucleus, binds to the ARE (thin arrow), and initiates EGFP expression (thick arrow; C).
