![]() Figure 3 of
Prow, Mol Vis 2006;
12:616-625.
Figure 3 of
Prow, Mol Vis 2006;
12:616-625.
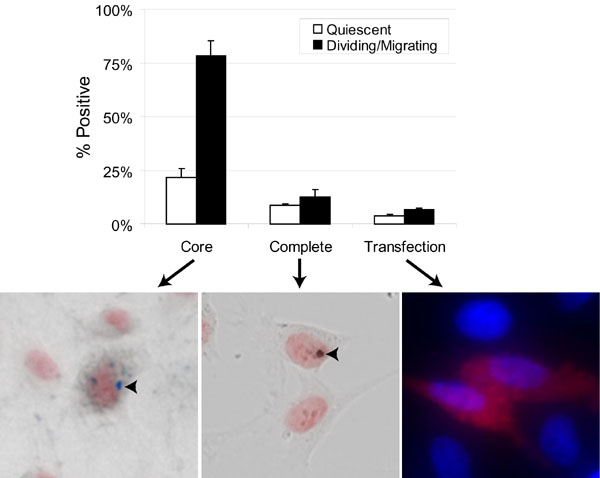
Figure 3. The presence of magnetic nanoparticle components in transfected cells
These data represent a breakdown of the magnetic nanoparticles (MNP) components in either quiescent or dividing/migrating cells. This data set was generated by exposing scraped ADRECs to MNP, which included lipid coated nanoparticles tethered to DsRed DNA (Transfection) or lipid coated nanoparticles tethered to alkaline phosphatase protein (Complete). The same cells used for the Transfection data were later evaluated for the Core data with Prussian blue staining. Prussian blue staining (bottom left, arrow head) for iron was used to quantify the number of cells containing nanoparticles (Core) in the MNP treated cells. The APase activity (bottom center, arrow head) was used as a surrogate for determining the number of cells with complete nanoparticles (Complete). Cells positive for DsRed were quantified to assess the number of successfully transfected cells (Transfection, bottom right photomicrograph, where DsRed is red and Hoechst 33342 counterstain is blue). The cells were treated with a minimal dose of nanoparticles (10 μl per well of a 6 well plate, n=3) and were stained 24 h after nanoparticle treatment. Values are the average of three measurements; error bars represent the standard error of the mean.