![]() Figure 2 of
Prow, Mol Vis 2006;
12:616-625.
Figure 2 of
Prow, Mol Vis 2006;
12:616-625.
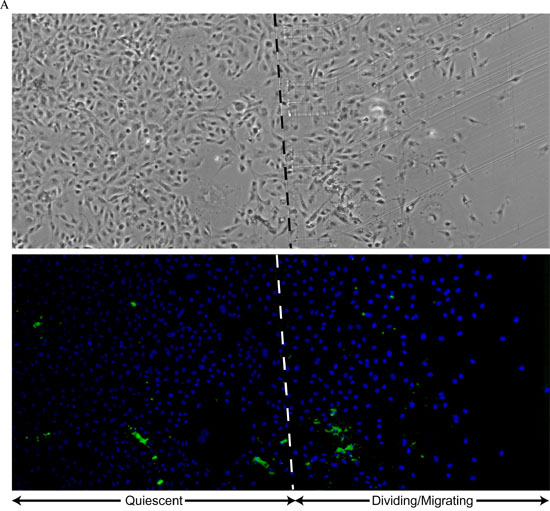
Figure 2. Characterization of magnetic nanoparticle penetration
Twenty four h after nanoparticle treatment the cells were developed for alkaline phosphatase activity (pseudocolored green). A: Phase contrast (top) and pseudocolored (bottom) micrographs of a typical field containing quiescent, dividing, and migrating ADRECs. Nuclei were counterstained with DAPI (blue, bottom panel). The scrape line is visible at the junction between the quiescent and dividing/migrating cells (dashed line). This field was part of a well (from a 24 well plate) that was treated with 20 μl of alkaline phosphatase protein coated nanoparticles. B: Graphs of data from image analysis of nanoparticle-treated cells. The cell morphology (quiescent, dividers, and migrators) was used as a basis for determining nanoparticle targeting trends. The mean percent and standard deviation of positive cells was calculated from an n=3. At least 2000 cells were analyzed from each group. The cells were treated with one of four volumes (μl) of a single preparation of nanoparticles (0, 5, 10, and 20 μl) which permitted the dose response to be determined in various cell morphology groups. The inset is a pie chart showing the proportions of the three cell types in the samples analyzed.