![]() Figure 3 of
Prow, Mol Vis 2006;
12:606-615.
Figure 3 of
Prow, Mol Vis 2006;
12:606-615.
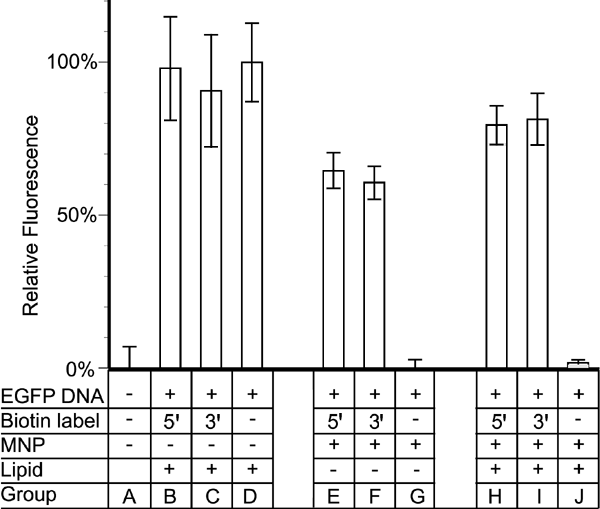
Figure 3. Expression levels of enhanced green fluorescent protein from lipid-coated and uncoated DNA tethered magnetic nanoparticles
In vitro gene expression levels are shown as the percentage of lipofectamine-transfected enhanced green fluorescent protein DNA. Biotin tagged DNA was also transfected into cells. All samples were incubated with or without lipofectamine 2000.
