![]() Figure 7 of
Lutty, Mol Vis 2006;
12:532-580.
Figure 7 of
Lutty, Mol Vis 2006;
12:532-580.
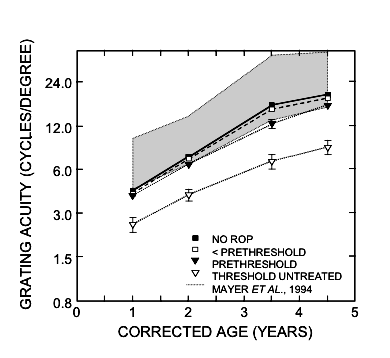
Figure 7. Acuity development in eyes with quantifiable grating acuity in the CRYO-ROP study
The shaded area represents the 95% prediction limits for healthy full-term children with no ocular abnormalities reported by Mayer et al. [108]. Not represented in this graph are eyes with vision too poor to be quantifiable with the Teller acuity card procedure (less than 3% of eyes in the no-ROP, less than prethreshold, and prethreshold groups, and approximately 50% of eyes in the threshold untreated group). Numbers of eyes in each group at the four test ages, respectively, are: no-ROP (213, 276, 344, 380), less than prethreshold (295, 384, 468, 496), prethreshold (64, 92, 96, 98), and threshold untreated (78, 89, 94, 98). Bars represent the standard error of the mean.
Republished with permission of The Association for Research in Vision & Ophthalmology from Dobson V, Quinn GE, Summers CG, Saunders RA, Phelps DL, Tung B, Palmer EA. Effect of acute-phase retinopathy of prematurity on grating acuity development in the very low birth weight infant. The Cryotherapy for Retinopathy of Prematurity Cooperative Group. Invest Ophthalmol Vis Sci 1994; 35:4236-44.
