![]() Figure 2 of
Chavarria-Soley, Mol Vis 2006;
12:523-531.
Figure 2 of
Chavarria-Soley, Mol Vis 2006;
12:523-531.
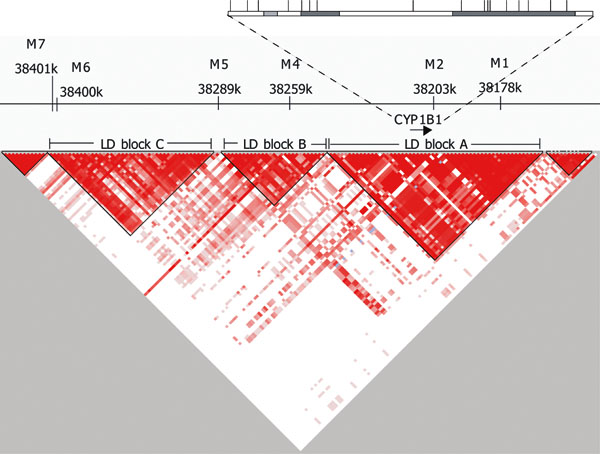
Figure 2.
Linkage disequilibrium (LD) structure of the region surrounding the CYP1B1 gene. Dark red squares represent regions of high LD. The location of the microsatellite markers relative to the CYP1B1 gene is shown (physical positions in chromosome 2 are according to UCSC). The relative single nucleotide polymorphism position used to form haplotype blocks is shown above the enlarged genomic CYP1B1 region (compare with Table 3). Exons are shaded in grey.