![]() Figure 2 of
Dash, Mol Vis 2006;
12:499-505.
Figure 2 of
Dash, Mol Vis 2006;
12:499-505.
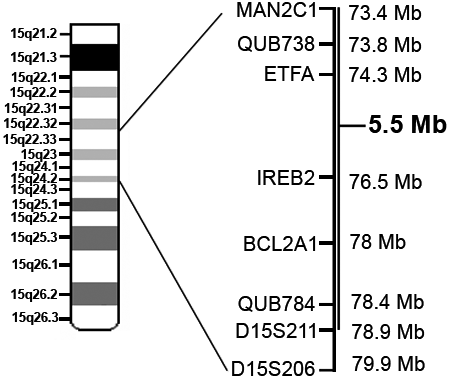
Figure 2. Map of the linked region of keratoconus with cataract on chromosome 15q
The linkage markers used in this study are shown on the left with their relative positions (NCBI Build 35.1 map) on the right. The heavy bar (5.5 Mb) represents the critical region of the locus for keratoconus with cataract.
