![]() Figure 5 of
Barren, Mol Vis 2006;
12:492-498.
Figure 5 of
Barren, Mol Vis 2006;
12:492-498.
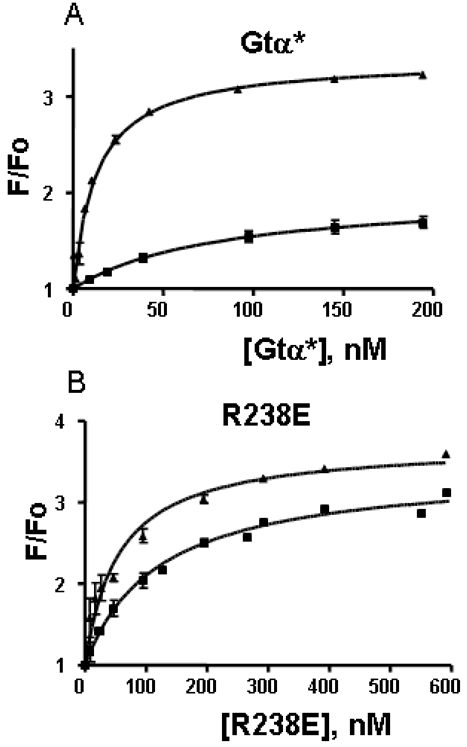
Figure 5. Binding of Gtα* and Gtα*R238E to PγBC
The relative increase in fluorescence (F/Fo) of PγBC (15 nM, excitation at 445 nm, emission at 495 nm) was determined in the presence of increasing concentrations of Gtα* (A) or Gtα*R238E (B) in the GDP-(rectangle) and GDPAlF4--(triangle) conformations. A: The Kd values (nM) are 83±10 (rectangle) and 13±1 (triangle). B: The Kd values (nM) are 120±12 (rectangle) and 55±8 (triangle).
