![]() Figure 3 of
Barren, Mol Vis 2006;
12:492-498.
Figure 3 of
Barren, Mol Vis 2006;
12:492-498.
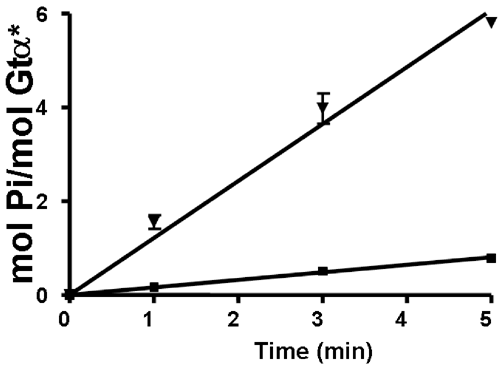
Figure 3. Steady state GTPase activities of Gtα* and Gtα*R238E
Steady state GTPase activities of Gtα* (down triangle) and Gtα*R238E (rectangle, 1 μM each) were measured in the presence of uROS membranes (1 μM rhodopsin). The assay was initiated with the addition of 20 μM [γ-32P]GTP (0.5 μCi). Aliquots were withdrawn at the indicated times and free 32Pi was measured by liquid scintillation counting. The rates of GTP hydrolysis (mol Pi/mol Gtα*min) are 1.21±0.05 (or 0.02/s; down triangle) and 0.161±0.003 (or 0.0027/s; rectangle).
