![]() Figure 2 of
Qin, Mol Vis 2006;
12:485-491.
Figure 2 of
Qin, Mol Vis 2006;
12:485-491.
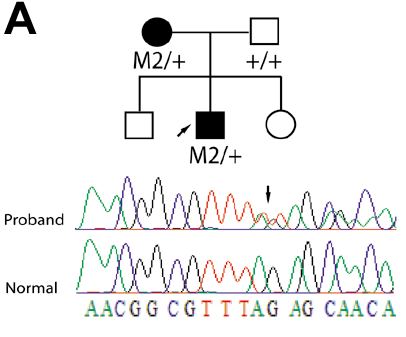
Figure 2. Novel mutation of R194/fsX228 detected from Family 2 and the predicted amino acids change
A: The schematic representation of Family 2 is shown on the top panel. Arrow indicates the proband and the filled solid symbol identifies the affected individual. Genotypes of individuals from whom sequence data were obtained are presented as shown. Plus signs indicate the wild type, and M2 indicates the truncated mutation of R194/fsX228. The sequence chromatograms are shown at the bottom panel with proband (upper) and that of normal individual (lower) with an arrow pointing to the nucleotide change. B: DNA and amino acid sequences alignment between mutant and wild type transcripts. Frame shifted region for mutant transcript is in red color.
B:
R194/fsX228           gacttttttacctcaggttctccggaagaaacggcgtttttagagcaacagatcgtggat 600
                       D  F  F  T  S  G  S  P  E  E  T  A  F  L  E  Q  Q  I  V  D
OPA1-wild type        gacttttttacctcaggttctccggaagaaacggcgtttagagcaacagatcgtggatct 600
                       D  F  F  T  S  G  S  P  E  E  T  A  F  R  A  T  D  R  G  S

R194/fsX228           ctgaaagtgacaagcattttagaaaggtgtcagacaaagagaaaattgaccaacttcagg 660
                       L  K  V  T  S  I  L  E  R  C  Q  T  K  R  K  L  T  N  F  R
OPA1-wild type        gaaagtgacaagcattttagaaaggtgtcagacaaagagaaaattgaccaacttcaggaa 660
                       E  S  D  K  H  F  R  K  V  S  D  K  E  K  I  D  Q  L  Q  E

R194/fsX228           aagaacttctgcacactcagttgaagtatcagagaatcttggaacgattagaaaaggaga 720
                       K  N  F  C  T  L  S  *  S  I  R  E  S  W  N  D  *  K  R  R
OPA1-wild type        gaacttctgcacactcagttgaagtatcagagaatcttggaacgattagaaaaggagaac 720
                       E  L  L  H  T  Q  L  K  Y  Q  R  I  L  E  R  L  E  K  E  N
|