![]() Figure 6 of
Davies, Mol Vis 2006;
12:467-477.
Figure 6 of
Davies, Mol Vis 2006;
12:467-477.
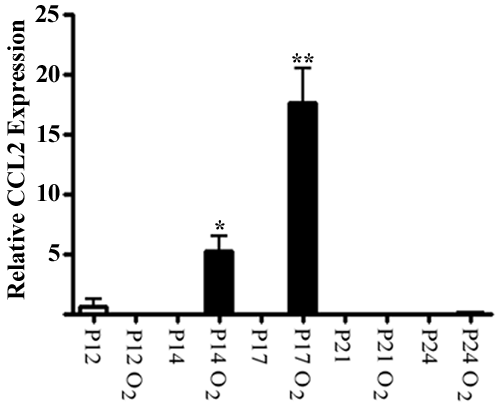
Figure 6. CCL2 mRNA expression in oxygen-induced retinopathy
Quantification of real-time readings of reverse transcriptase polymerase chain reaction products for relative CCL2 expression normalized to β-actin. Results are expressed as mean±SEM as analyzed by one-way ANOVA, followed by Tukey's multiple comparison post-test; a single asterisk indicates p<0.05 and a double asterisk indicates p<0.001.