![]() Figure 4 of
Medvedovic, Mol Vis 2006;
12:422-440.
Figure 4 of
Medvedovic, Mol Vis 2006;
12:422-440.
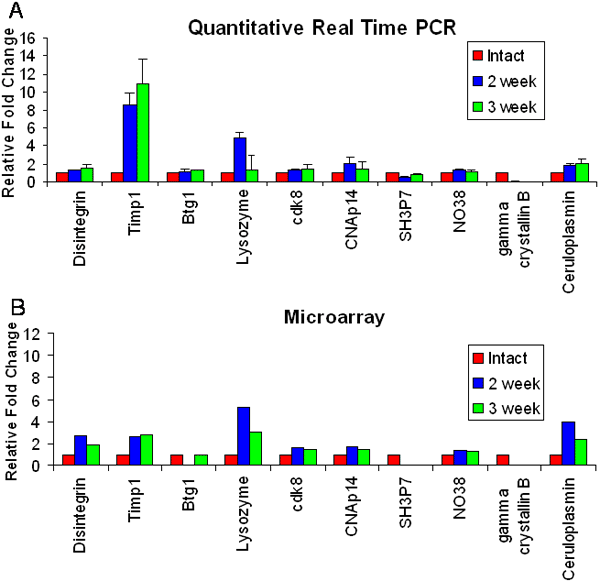
Figure 4.
QPCR analysis (A) of ten selected genes and the corresponding data from the microarray analysis (B). The expression values of lens mRNA at 2 and 3 weeks post-surgery are compared with lens mRNA from the non-operated eye (value set at 1). C: The values between the two methods.

C:
                       Microarray          Quantitative real time PCR
                ------------------------   --------------------------
    Gene        Intact   2 week   3 week   Intact    2 week    3 week
-------------   ------   ------   ------   ------    ------    ------
Disintegrin       1       2.69     1.93      1        1.29      1.54
Timp1             1       2.62     2.75      1        8.56     10.87
Btg1              1      -1.3      1.02      1        1.2       1.3
Lysozyme          1       5.29     3.12      1        4.9       1.3
Cdk8              1       1.62     1.46      1        1.33      1.49
CNAp14            1       1.73     1.49      1        2.13      1.49
SH3P7             1      -1.88    -1.46      1        0.56      0.73
NO38              1       1.38     1.26      1        1.28      1.14
γB-Crystallin     1      -1.53    -2.06      1        0.03      0.007
Ceruloplasmin     1       4.01     2.39      1        1.77      2.04
|