![]() Figure 3 of
Chung, Mol Vis 2006;
12:415-421.
Figure 3 of
Chung, Mol Vis 2006;
12:415-421.
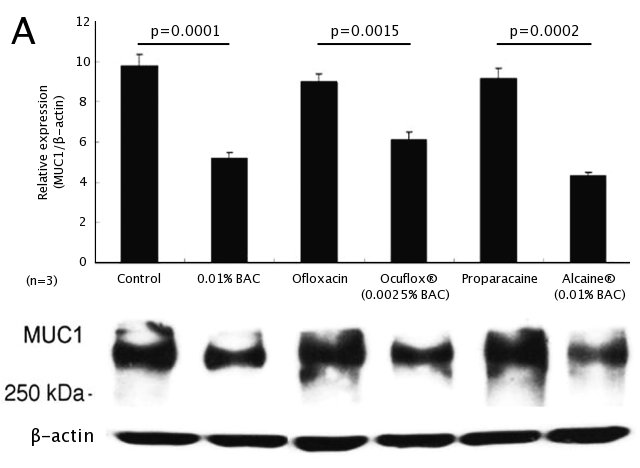
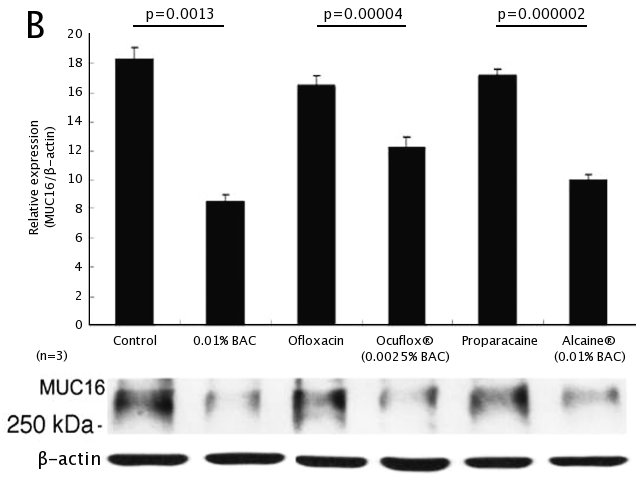
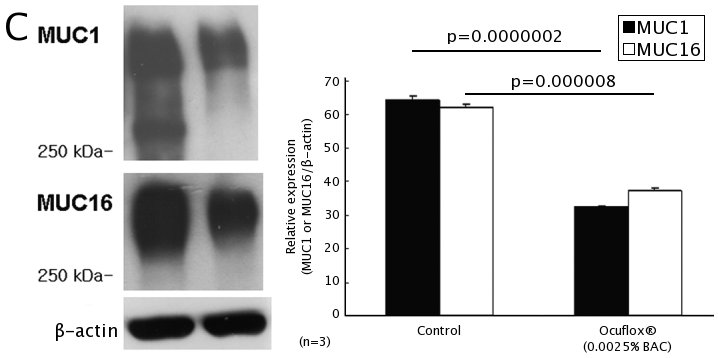
Figure 3. Western blot and densitometric analyses
Western blotting was used to measure MUC1 and MUC16 in both human corneal-limbal epithelial (HCLE) cells and human corneal epithelium exposed to different concentrations of benzalkonium chloride (BAC). HCLE cells (A,B) exposed to BAC had decreased MUC1 and MUC16 protein levels (p<0.05). There is the suggestion of a concentration response in the data, but the data set is not suitable for a statistical test of trend. The human corneal epithelium (C) of patients treated with Ocuflox® eyedrops also had a decrease in MUC1 and MUC16 protien levels (p<0.05). A: The bar graph shows the quantity of MUC1 (relative to β-actin) in the six groups: control, BAC media, ofloxacin solution, Ocuflox® eyedrops, proparacaine solution, and Alcaine® eyedrops. B: The bar graph shows the quantity of MUC16 (relative to β-actin) in the same six groups. C: The bar graph shows the quantities of MUC1 and MUC16 (relative to β-actin) in the control and Ocuflox® eyedrops groups. The values in these graphs represents the mean of three experiments; the error bars represent the standard deviation. Values were normalized to the density of the respective band of β-actin.