![]() Figure 1 of
Cryan, Mol Vis 2006;
12:405-414.
Figure 1 of
Cryan, Mol Vis 2006;
12:405-414.
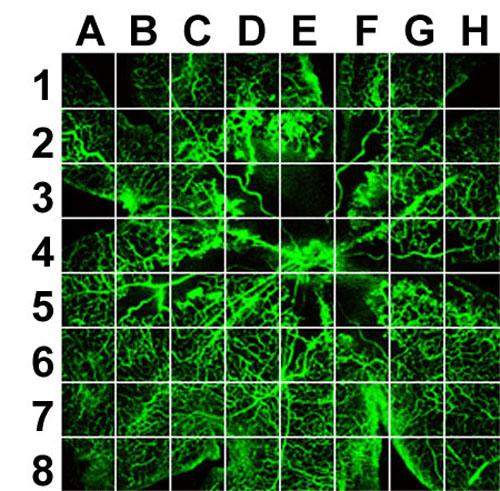
Figure 1. Quantitative analysis of the degree of retinal ischemia and neovascular tuft formation in fluorescein-perfused retinal flatmount preparations
Each of the 64 areas that comprise the total image (magnification 4x) of the retinal flatmount preparation were evaluated by two independent observers as having no retinal tissue present or being empty of tissue (E), normal tissue (N), ischemic/non-perfused tissue (I), or neovascular tuft tissue (T). Up to three annotations were permitted for each area. For example, Area A1 was described as empty (E) and normal (N), area C3 was described as ischemic (I), normal (N) and containing neovascular tufts (T) and area E3 was described as ischemic (I) by both observers. Areas where retinal tissue was absent/empty (E) were subtracted prior to calculation of the percentage area of normal, ischemic or neovascular tissue. Areas where retinal tissue was absent/empty (E) were subtracted prior to calculation of the percentage area of normal, ischemic, or neovascular tissue.