![]() Figure 3 of
Le, Mol Vis 2006;
12:389-398.
Figure 3 of
Le, Mol Vis 2006;
12:389-398.
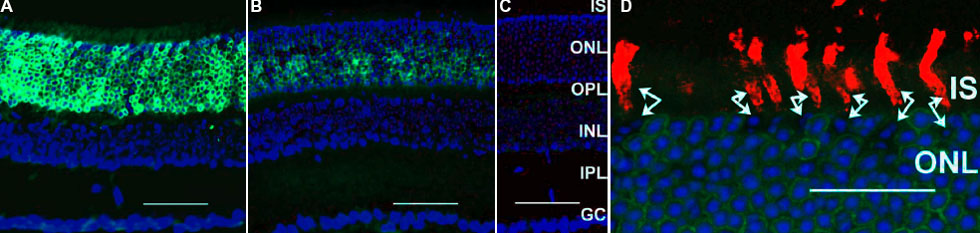
Figure 3. Localization of Cre expression with immunohistochemistry
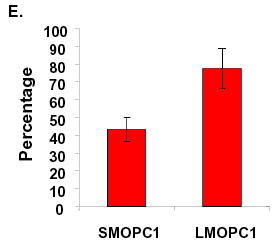
Immunohistochemical detection of Cre in retinal sections of six-week-old LMOPC1 (A,D), SMOPC1 (B), and wild-type control (C) mice. Green, IHC staining for Cre; Blue, DAPI staining for nucleus; Red, peanut agglutinin (PNA) staining for cone photoreceptors. The scale bar represents 50 μm in A-C and 20 μm in D. Photoreceptor inner segment (IS), outer nuclear layer (ONL), outer plexiform layer (OPL), inner nuclear layer (INL), inner plexiform layer (IPL), and ganglion cell layer (GC) are labeled. Cre expression was detected in rod photoreceptor nuclei in the LMOPC1 (A) mice and the SMOPC1 (B) mice. LMOPC1 mice expressed relatively more Cre than the SMOPC1 mice. D: Confocal microscopy of Cre and PNA double labeled retinal section from the SMOPC1 mice. Each set of double arrows indicates two parts of a cone photoreceptor, cone outer segment and their corresponding non-Cre stained nucleus, suggesting that cone photoreceptors did not express Cre. E: Quantitative analysis of Cre-expressing rods in three-month-old LMOPC1 mice and SMOPC1 mice by confocal microscopy. The ratios of Cre-expressing rod photoreceptors were calculated from the number of Cre-positive nuclei.