![]() Figure 1 of
Le, Mol Vis 2006;
12:389-398.
Figure 1 of
Le, Mol Vis 2006;
12:389-398.
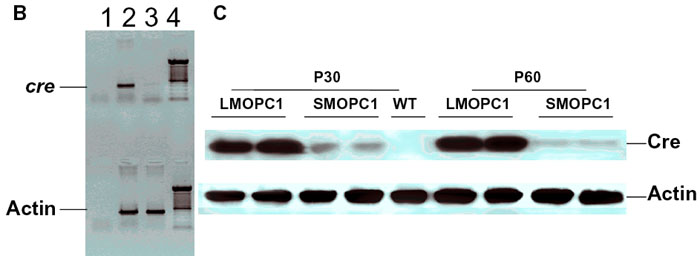
Figure 1. Generation of mouse opsin promoter-controlled cre mice
A: Schematic drawing of transgenic constructs. SMOP represents the 0.2-kb short mouse opsin promoter, LMOP represents the 4.1-kb long mouse opsin promoter, cre represents the coding region of Cre recombinase gene, and MT-1 A(n) represents mouse metallothionein polyadenylation signal. B: Inverted gel image of a representative RT-PCR analysis of cre expression in mouse retinas. Lanes 1 to 4: label negative control (-RT) of a cre positive mouse (1), RT-PCR of a cre-positive mouse (2), RT-PCR of a cre-negative mouse (3), and 100 bp DNA marker (4). C: Comparison of Cre expression between LMOPC1 and SMOPC1 mice with Western blot. Homogenized retinal proteins (30 μg) from two different mice were used for each group. LMOPC1 mice produced more Cre than SMOPC1 mice. No significant change in Cre concentration was observed from P30 to P60 in either the LMOPC1 mice or the SMOPC1 mice.