![]() Figure 5 of
Steely, Mol Vis 2006;
12:372-383.
Figure 5 of
Steely, Mol Vis 2006;
12:372-383.
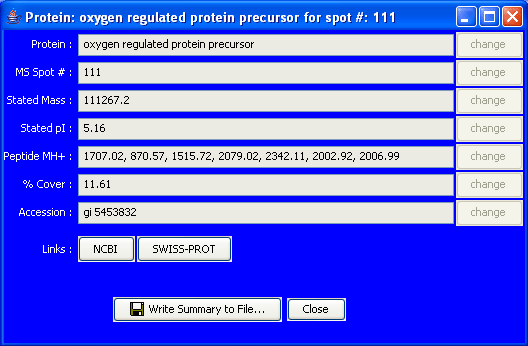
Figure 5. An example of the bioinformatic window for annotated spots in proteomic gels at the Human Ocular Proteome website
An example of the bioinformatic data included for protein spots annotated in the GTM3 proteome. The site uses a subprogram called "2-D Gel Viewer" that allows the user to click on a spot in the image and retrieve the protein ID, mass spectral data, and hotlinks for that protein to the NCBI Protein database and Swiss Prot. In this case the spot selected was number 111, oxygen-regulated protein, that had been previously selected in Figure 4.
