![]() Figure 7 of
Spoerri, Mol Vis 2006;
12:32-42.
Figure 7 of
Spoerri, Mol Vis 2006;
12:32-42.
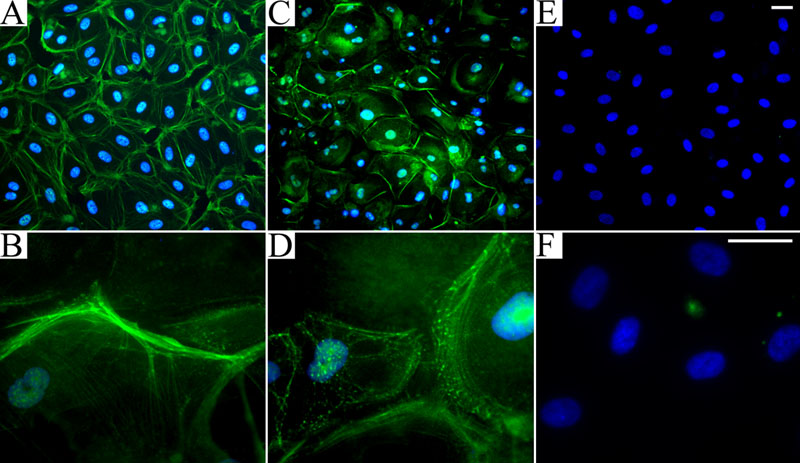
Figure 7. Loss of tight junction integrity in human retinal endothelial cells (HRECs) grown in 25 mM glucose
Representative photomicrographs of HRECs grown in low glucose medium (A,B,E,F) or high glucose medium (C,D). A-D: Tight junctions are visualized with an antibody to occludin (FITC, green) and nuclei are visualized with DAPI (blue). E,F: Controls for background were not treated with the occludin antibody; nuclei are visualized with DAPI (blue). Note the reduced fluorescence and disruption of the tight junctions formed between HRECs grown in high glucose (C,D) compared to HRECs grown in low glucose (A,B). Less occludin detection with clear areas of disruption are seen (C); however, some cytoplasmic autofluorescence is evident. The original magnifications were 200x (A,C,E) and 630x (B,D,F). The scale bars represent 50 μm.