![]() Figure 3 of
Kloeckener-Gruissem, Mol Vis 2006;
12:350-355.
Figure 3 of
Kloeckener-Gruissem, Mol Vis 2006;
12:350-355.
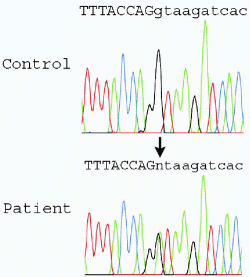
Figure 3. CSPG2 splice mutation
Electropherogram displays 18 nucleotides surrounding the heterozygous splice donor mutation (c.9265+1G>A). Capital letters designate exon 8 sequences; lowercase letters represent intron 8 sequences. The "n" in the sequence depicts the heterozygous sequence mutation of the index patient.
