![]() Figure 2 of
Kloeckener-Gruissem, Mol Vis 2006;
12:350-355.
Figure 2 of
Kloeckener-Gruissem, Mol Vis 2006;
12:350-355.
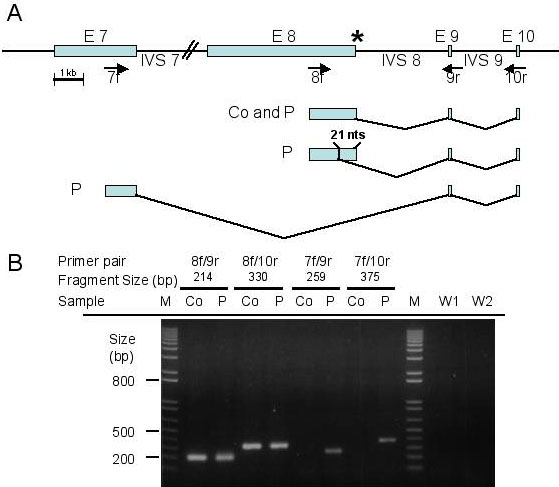
Figure 2. CSPG2 transcript analysis
Schematic diagram (A) and gel electrophoresis (B) show the accumulation of normal and aberrant splice products of CSPG2 in control and patient venous blood RNA as determined by RT-PCR analysis. A: The size of exon (E) 7 through 10 and intron (IVS) 7 through 9 is given in base pairs (bp). IVS7 and primers 7f, 8f, 9r, and 10r are not drawn to scale. Primer arrows point to 3' direction. Asterisk (*) symbolizes the c.9265+1G>A splice site mutation. To the left of the diagrammed splice products is indicated the sample in which the respective fragment was found. B: Ethidium bromide stained agarose gel shows migration of the 1 kb molecular weight marker (M) and RT-PCR products from control (Co) and patient (P) RNA samples. Expected fragment sizes are noted below each primer combination. Water templates (W) did not show any amplification products.