![]() Figure 4 of
Hawse, Mol Vis 2006;
12:342-349.
Figure 4 of
Hawse, Mol Vis 2006;
12:342-349.
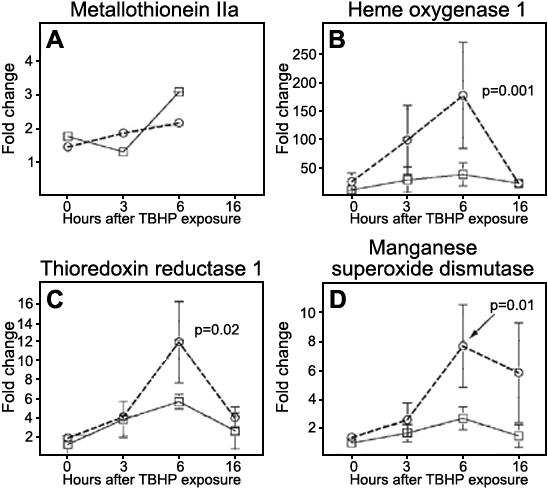
Figure 4. Expression of MTIIa, HO-1, TrxR1, and MnSOD in cells after treatment with TBHP
Real-time RT-PCR analysis of MTIIa (A), heme oxygenase-1 (B), thioredoxin reductase-1 (C), and manganese superoxide dismutase (D) in control (solid lines) and MTIIa over-expressing (dashed lines) human lens epithelial cells. Both cell lines were first treated with 0.5 mM TBHP for 3 h and then cultured in normal medium for the indicated times. Results are expressed as calculated fold changes for TBHP-treated control and MTIIa over-expressed cells, compared to the same cells not treated with TBHP. β-Actin was used as an internal control for each reaction. The error bars represent standard deviations for n=3 (B-D).
