![]() Figure 3 of
Hawse, Mol Vis 2006;
12:342-349.
Figure 3 of
Hawse, Mol Vis 2006;
12:342-349.
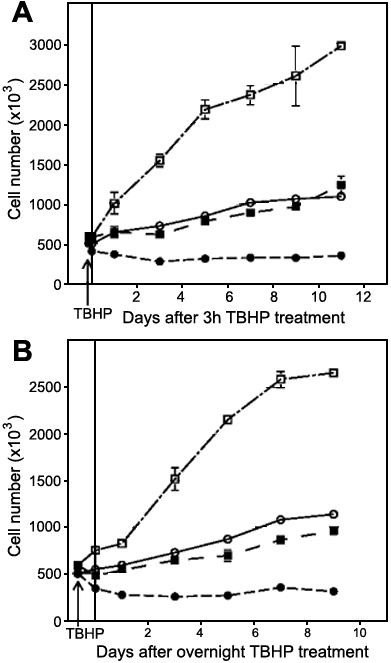
Figure 3. Growth of control and MTIIa over-expressing human lens epithelial cells on days 1, 3, 5, 7, 9, and 11 following 0.5 mM TBHP treatment for indicated times
A shows the number of control and MTIIa over-expressing cells with and without a 3 h 0.5 mM TBHP treatment on indicated days after exposure. B shows the number of control and MTIIa over-expressing cells with and without an overnight 0.5 mM TBHP treatment on indicated days after exposure. In both A and B, the open circles represent control cells minus TBHP, the filled circles represent control cells plus TBHP, the open squares represent MTIIa over-expressing cells minus TBHP, and the filled squares represent MTIIA over-expressing cells plus TBHP. The error bars represent standard deviations of three separate assays (the absence of bars indicates a very small standard deviation).
