![]() Figure 2 of
Hawse, Mol Vis 2006;
12:342-349.
Figure 2 of
Hawse, Mol Vis 2006;
12:342-349.
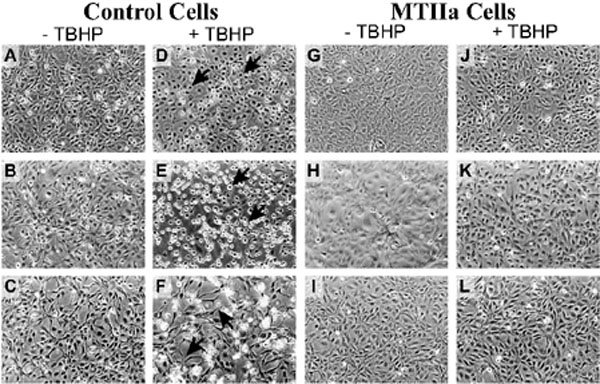
Figure 2. Metallothionein IIa over-expression in human lens epithelial cells confers resistance to TBHP exposure
The top row shows cells after 3 h exposure, the middle row shows cells after 6 h exposure, and the bottom row shows cells after overnight exposure. A-C: Light micrograph images of control cells not exposed to TBHP. D-F: Light micrograph images of control cells following 0.5 mM TBHP treatment for indicated times. Arrows identify condensed nuclei (D), rounded-up cells (E), and threadlike structures (F). G-I: Light micrograph images of MTIIa over-expressing cells not exposed to TBHP. J-L: Light micrograph images of MTIIa over-expressing cells following 0.5 mM TBHP treatment for indicated times. All results are representative of those obtained for three experiments.