![]() Figure 2 of
Suganthalakshmi, Mol Vis 2006;
12:336-341.
Figure 2 of
Suganthalakshmi, Mol Vis 2006;
12:336-341.
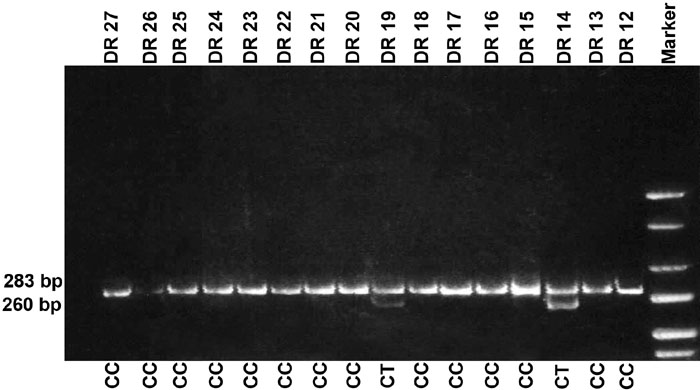
Figure 2. Detection of VEGF C(-7)T polymorphism by RFLP analysis
The genotypes associated with the C(-7)T polymorphism were restriction digested with DdeI, and the fragments were visualized on a 3% agarose gel. Fragment size for each allele given in Table 2. The 283 bp band indicates the C allele, the 260 bp band indicates the T allele, and the 283 bp and 260 bp bands indicate the CT genotype. Based on this banding pattern the genotype is provided below each well. The molecular marker is a Puc19 ladder.