![]() Figure 1 of
Suganthalakshmi, Mol Vis 2006;
12:336-341.
Figure 1 of
Suganthalakshmi, Mol Vis 2006;
12:336-341.
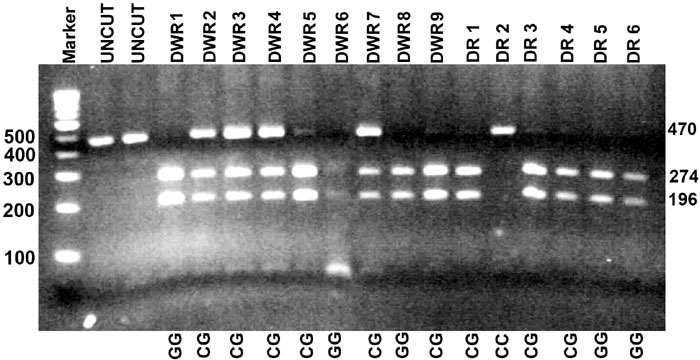
Figure 1. RFLP analysis for VEGF C(-634)G polymorphism
BsmF1 restriction enzyme analysis showing the genotypes of the VEGF C(-634)G region, separated on a 3% agarose gel. Fragment size for each allele given in Table 2. The 470 bp band indicates the C allele, the 274 and 196 bp band indicates the G allele, and the 470 bp, 274 bp, and 196 bp bands indicate the CG genotype. Based on this banding pattern the genotype is provided below for each well. The molecular marker is a 100 bp ladder.