![]() Figure 1 of
Gu, Mol Vis 2006;
12:26-31.
Figure 1 of
Gu, Mol Vis 2006;
12:26-31.
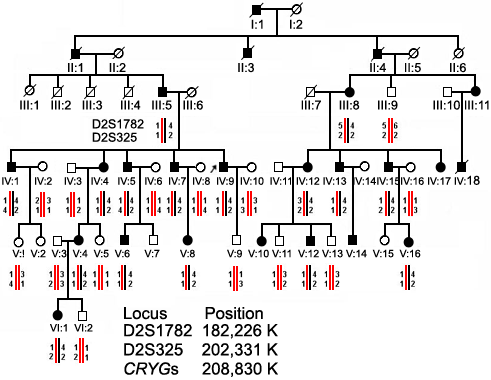
Figure 1. Cataract pedigree and haplotype analysis
Pedigree and haplotype analysis of the cataract family showing segregation of two microsatellite markers on chromosome 2q33-35, listed in descending order from the centromeric end. Squares and circles symbolize males and females, respectively. Black and red lines denote afffected and unaffected status, respectively. The figure also shows the position of the locus and disease gene. D2S325 (position: 202,331 K) is closer to the disease gene (208,830 K) than D2S1782 (182,226 K).
