![]() Figure 5 of
Flynn, Mol Vis 2006;
12:271-282.
Figure 5 of
Flynn, Mol Vis 2006;
12:271-282.
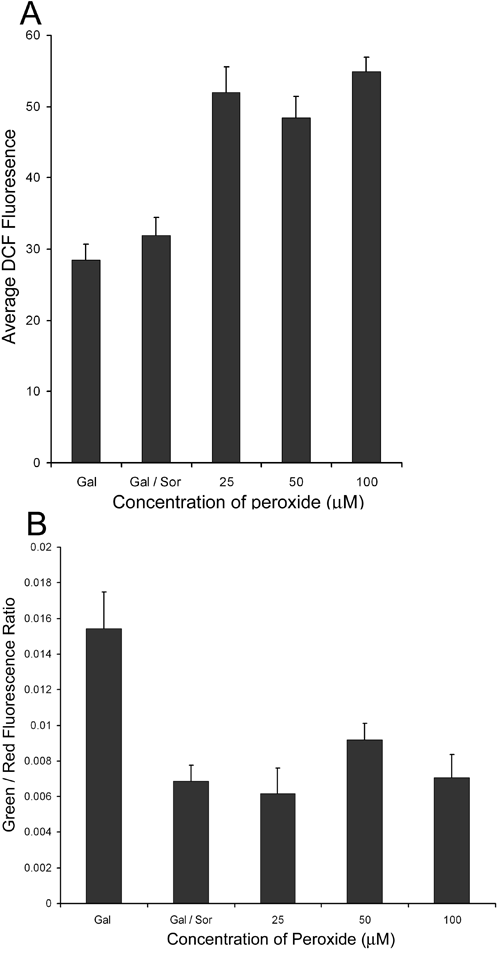
Figure 5. DCF and JC-1 staining of BLEC cultures after bolus addition of peroxide
A: Bovine lens epithelial cells were cultured in MEM plus Sorbinil and subsequently switched to galactose (Gal)/Sorbinil for three days; parallel cell cultures were maintained in Gal alone. Gal/Sorbinil-treated cells received 25, 50, or 100 μM bolus addition of peroxide and incubated 90 min prior to staining; Gal-maintained cells were not administered bolus peroxide. DCF fluorescence, an indication of intracellular accumulation of reactive oxygen species, was graphed as the average fluorescence intensity verses the concentration of the peroxide addition. Average fluorescence intensity of Gal/Sorbinil-treated cells markedly increased with exogenous peroxide addition; the mean average fluorescence intensity of Gal-treated cells was similar to Gal/Sor-treated cells in the absence of added hydrogen peroxide. The data is based on seven random confocal images. B: BLECs were treated as above with the exception that JC-1 was employed to assess the mitochondrial membrane potential. The bar graph represents the ratio of the green and red fluorescence channels as described in the Methods. Note the increase in the degree of depolarization of Gal-treated cells relative to Gal/Sor-treated cells. Gal/Sor-treated cells failed to show a change in mitochondrial depolarization up through the addition of 100 μM H2O2. The data is based on seven random confocal images. Error bars represent the standard error of the mean.
