![]() Figure 4 of
Flynn, Mol Vis 2006;
12:271-282.
Figure 4 of
Flynn, Mol Vis 2006;
12:271-282.
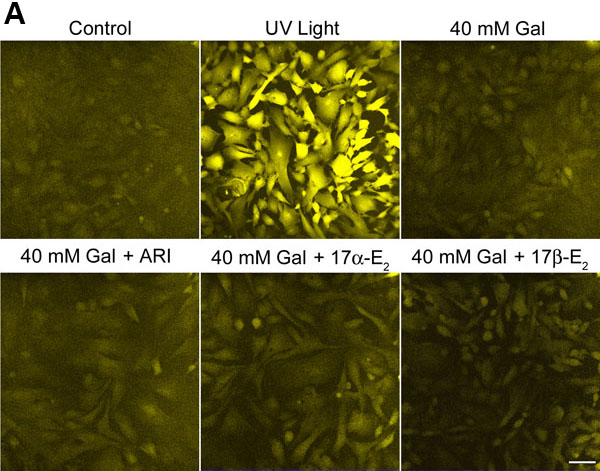
Figure 4. Confocal images of intracellular ROS generation from bovine lens epithelial cells in galactose-maintained and galactose-free cultures
A: Confluent monolayers of BLECs were maintained in MEM or galactose (Gal) with or without Sorbinil (ARI), 17α-estradiol, or 17β-estradiol for three days. BLECs were preloaded with DCFH-DA to capture the ROS generated. The confocal images represent a randomly chosen field after three days of cell culture under the various experimental treatments. One set of control cells was exposed to UV light as a positive control to demonstrate effective dye loading. The scale bar represents 20 μm. B: Statistical analysis of the average fluorescence intensity from the cells shown in Panel A (n=8, p>0.05). The plus sign (+) represents a significant increase in UV light-induced fluorescence intensity relative to control cells. The asterisk represents a significant increase in fluorescence intensity of Gal with or without 17α-estradiol or 17β-estradiol cells relative to control cells. Error bars represent the standard error of the mean.