![]() Figure 1 of
Flynn, Mol Vis 2006;
12:271-282.
Figure 1 of
Flynn, Mol Vis 2006;
12:271-282.
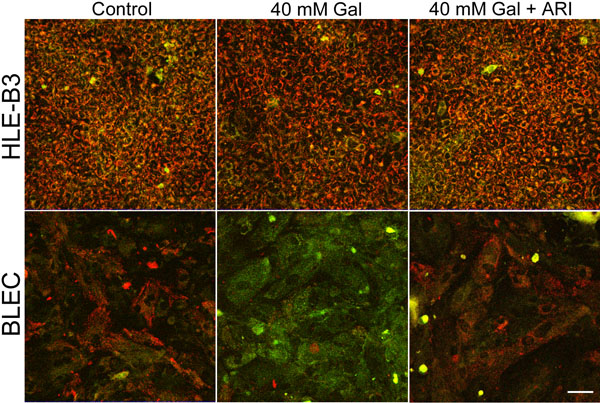
Figure 1. Polyol accumulation prompts mitochondrial membrane depolarization
A: Representative confocal images of JC-1 staining after five day exposure to 40 mM galactose (Gal) indicating substantial mitochondrial depolarization of BLECs, marginal in HLE-B3 cells. Control cells accumulating the JC-1 dye in the mitochondria give a red appearance to the cells (left panels). Cultures maintained in high galactose media show a major shift to green in BLECs (bottom-middle panel) and only minimally so in the HLE-B3 cells (upper-middle panel). Addition of aldose reductase inhibitor to high galactose-exposed cultures prevents the mitochondrial membrane depolarization (right panels). The scale bar represents 20 μm. B: Statistical analysis of JC-1 images from Panel A, where individual red and green average fluorescence intensities were expressed as the ratio of green to red fluorescence. An increase in the bar indicates a shift in the fluorescence ratio correlating to an increase in mitochondrial depolarization. There was a significant increase in depolarization in the galactose treatment compared to the control treatment (asterisk) with both BLECs and HLE-B3 cells (n=8, p>0.05). Administration of an aldose reductase inhibitor significantly prevented depolarization of the mitochondria (+) relative to Gal (p>0.05). Error bars represent the standard error of the mean.
A: