![]() Figure 7 of
Mullins, Mol Vis 2006;
12:224-235.
Figure 7 of
Mullins, Mol Vis 2006;
12:224-235.
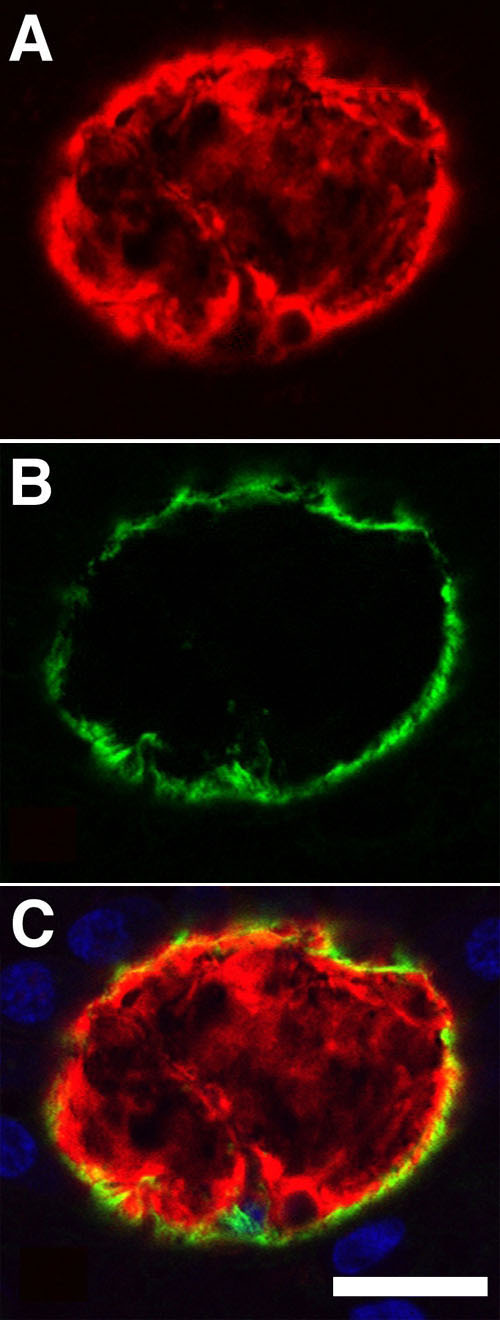
Figure 7. Labeling of ICAM-1 in photoreceptor aggregates
A: Photoreceptor aggregates present over a disficorm scar (not depicted) were labeled with peanut agglutinin (red). B: These aggregates also displayed a circumferential distribution of ICAM-1 (green). C: Merge of panels A and B with To-Pro-3 labeling of retinal nuclei (blue). Scale bar represents 20 μm.