![]() Figure 6 of
Mullins, Mol Vis 2006;
12:224-235.
Figure 6 of
Mullins, Mol Vis 2006;
12:224-235.
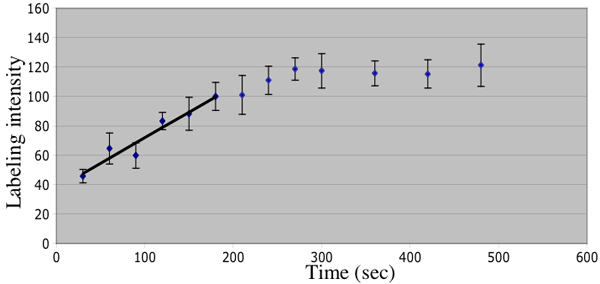
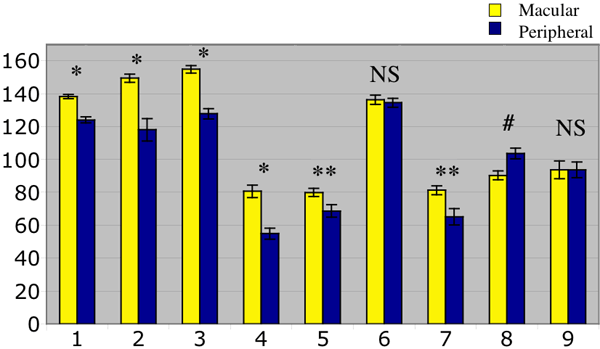
Figure 6. Graphs depicting ICAM-1 morphometry values
A: Mean capillary value measurements of macular serial sections incubated with ICAM-1 monoclonal antibody (clone P2A4) developed at 30 s intervals and measured as described in Materials and Methods. The 150 s time used for subsequent experimental measurements is within a linear range of values as depicted, with a correlation coefficient of 0.94 to 0.97. Error bars represent standard errors of the mean. B: Data from nine eyes used for morphometric measurements are shown. In six of nine eyes, a significantly greater labeling intensity was measured in the macular (yellow bars), as compared with extramacular (blue bars) choriocapillaris. In two cases, labeling was the same and in one of nine cases, the pattern was reversed. Asterisk (*) indicates p<0.001; double asterisk (**) indicates p<0.05; hash mark (#) indicates p<0.01 with peripheral values larger than macular values; nonsignificant comparisons are marked "NS".
A:

B:
