![]() Figure 4 of
Chaurasia, Mol Vis 2006;
12:215-223.
Figure 4 of
Chaurasia, Mol Vis 2006;
12:215-223.
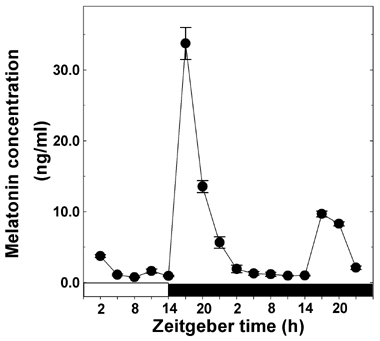
Figure 4. Circadian profile of melatonin release
For melatonin estimation, on day 8 starting at zeitgeber times (ZT) 0, media (1 ml) was collected and replaced simultaneously at the times indicated in the figure. Analysis of variance indicated significant differences between the day and night values of melatonin content (p<0.001) in light-dark (n=5-6) and dark-dark (n=4-6) with concentrations high at night and low during the day.