![]() Figure 3 of
Chaurasia, Mol Vis 2006;
12:215-223.
Figure 3 of
Chaurasia, Mol Vis 2006;
12:215-223.
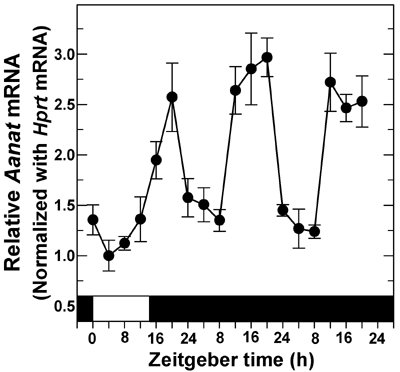
Figure 3. Circadian profile of Aanat transcript level
Each data point represents Aanat transcript normalized to Hprt mRNA, expressed relative to the lowest values in light-dark (LD). ANOVA indicated a significant rhythm (p<0.001) for Aanat mRNA with high values at night in LD and dark-dark (DD), compared to values in day. There were 4 cultures for each time.
