![]() Figure 1 of
Chaurasia, Mol Vis 2006;
12:215-223.
Figure 1 of
Chaurasia, Mol Vis 2006;
12:215-223.
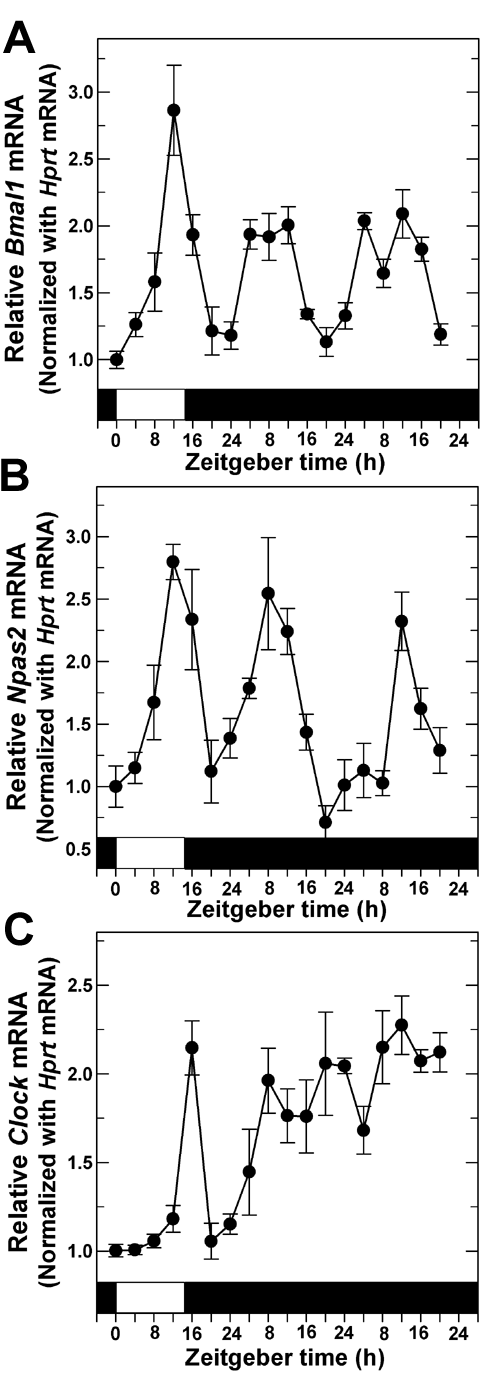
Figure 1. Temporal expression of positive modulators of the circadian clockwork system
Relative mRNA levels of Bmal1 (A) and Npas2 (B) in photoreceptor-enriched retinal cell cultures collected at the indicated zeitgeber times (ZT) in light-dark (LD) and dark-dark (DD). Each data point represents clock gene transcripts normalized to Hprt mRNA and expressed relative to the lowest values in LD. The open horizontal bar at the X-axis represents times of light exposure; the black bars represent times of darkness. Analysis of variance (ANOVA) indicated significant rhythms of Bmal1 and Npas2 transcripts in LD and DD (p<0.001), with highest levels in the late day and early night; n=4-6 cultures per time. C: Clock mRNA showed significantly higher values during the night (ZT 16) than during the day in LD (p<0.001); transcript levels increased on the first day of DD (ZT 0 compared to ZT 20; p<0.05) but there were no significant rhythms on DD1 or DD2. There were 5-6 cultures for each time.
