![]() Figure 2 of
Devi, Mol Vis 2006;
12:190-195.
Figure 2 of
Devi, Mol Vis 2006;
12:190-195.
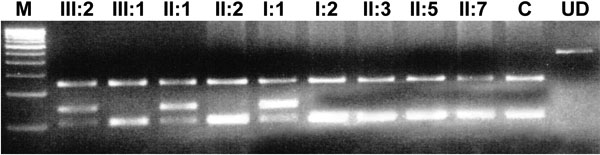
Figure 2. Analysis of family 2
A: The genomic sequence of the wild type pedigree showing an arginine at codon 198. B: The mutant allele showing a heterozygous T>A transition that substitutes Glu for Arg. C: Pedigree of family 2. D: PCR-RFLP analysis showing the loss of an MspI site in the mutant allele that results in 243 bp, 144 bp, 27 bp, 21 bp, and 16 bp bands while the normal allele shows 243 bp, 105 bp, 39 bp, 27 bp, 21 bp, and 16 bp bands. The latter 39 bp, 27 bp, 21 bp, and 16 bp bands are not visible on the gel. In the image, M indicates the 100 bp DNA ladder, C indicates control, and UD indicates undigested PCR product. E: A multiple sequence alignment of Cx50 with other connexin proteins. The amino acid marked in red indicates the position of R198, where ariginine is highly conserved among connexins.
D:
E:
CXA8_HUMAN 193 DCFVSRPTEKTIFILFMLSVASVSLFLNVMELGHLGLKGIR 233 CXA8_MOUSE 193 DCFVSRPTEKTIFILFMLSVAFVSLFLNIMEMSHLGMKGIR 233 CXA8_SHEEP 193 DCFVSRPTEKTIFILFMLSVASVSLFLNILEMSHLGLKKIR 233 CXA8_CHICK 193 DCFVSRPTEKTIFIMFMLVVAAVSLFLNLVEISHLILKRIR 233 CXA1_HUMAN 193 DCFLSRPTEKTIFIIFMLVVSLVSLALNIIELFYVFFKGVK 233 CXA3_HUMAN 193 DCFISRPTEKTIFIIFMLAVACASLLLNMLEIYHLGWKKLK 233 CXA4_HUMAN 193 DCFVSRPTEKTIFIIFMLVVGLISLVLNLLELVHLLCRCLS 233 CXA5_HUMAN 193 DCYVSRPTEKNVFIVFMLAVAALSLLLSLAELYHLGWKKIR 233 CXA10_HUMAN 193 DCFVSRPTEKTIFLLFMQSIATISLFLNILEIFHLGFKKIF 233 |