![]() Figure 4 of
LoGiudice, Mol Vis 2006;
12:184-189.
Figure 4 of
LoGiudice, Mol Vis 2006;
12:184-189.
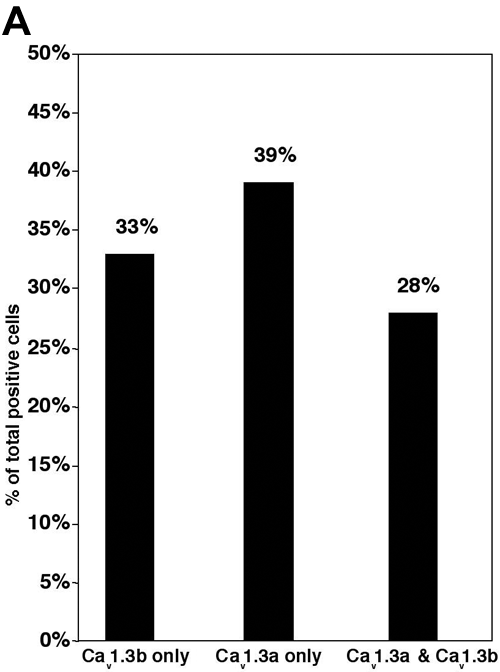
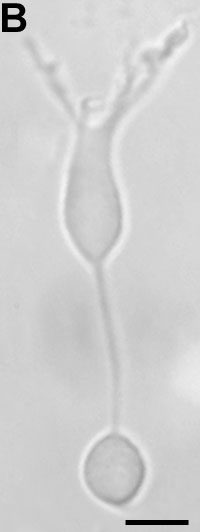
Figure 4. Goldfish bipolar cells form L-type Ca2+ channels composed of one or more subunits
A: Percentage of total positive cells expressing α1 subunits. Of the 18 cells positive for α1 subunits, 33% expressed only Cav1.3b, 39% express only Cav1.3a, and 28% expressed both subunits. B: Bright field image of an ON-type goldfish bipolar cell. Scale bar represents 10 μm.